利用 XHProf 查找 Magento 具体慢在哪

XHProf 是 Facebook 开源的一款轻量级的 PHP 分层性能测量分析器。 具体介绍请移步 http://php.net/manual/en/intro.xhprof.php

在 Linunx 上安装 XHProf, XHProf 对 PHP 的版本要求是 PHP 5.2以上:

  1. 首先最新的 XHProf 的源码包并解压缩: http://pecl.php.net/get/xhprof-0.9.4.tgz
1
2
wget http://pecl.php.net/get/xhprof-0.9.4.tgz
tar -xf xhprof-0.9.4.tgz
  1. 进入 xhprof-0.9.4 目录,使用 phpize 来编译 xhprof
1
2
3
cd xhprof-0.9.4
phpize
./configure

configure 期间可能会出一些问题,通过 baidu + google 解决。

  1. configure 完成之后,接着执行 make 和 make install
1
2
make
make install

make install 成功之后,会生成 xhprof.so 然后在 php.ini 中添加 xhprof 的 配置信息:

1
2
3
4
5
6
7
8
[xhprof]
extension=xhprof.so
;
; directory used by default implementation of the iXHProfRuns
; interface (namely, the XHProfRuns_Default class) for storing
; XHProf runs.
;
xhprof.output_dir=/var/www/html/xhprof

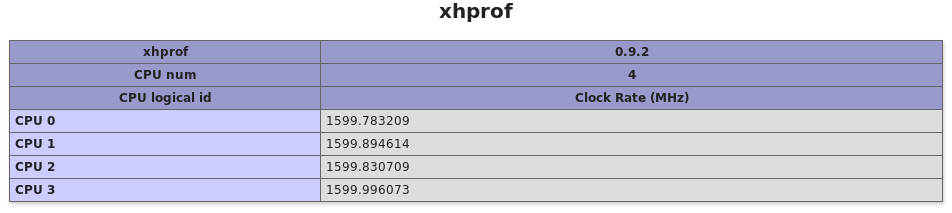
重启 apache 后,可以通过 phpinfo() 来查看 XHProf 是否安装成功。 phpinfo

XHProf 安装好之后,就可以开始使用它来分析 Magento 了。 通过在 Magento 入口文件 index.php 中添加 xhprof_enable() 和 xhprof_disable() 两个函数,就可以得到 Magento 某一个请求的整个 PHP 调用关系以及期间所消耗的时间。

1
2
3
4
//file: /index.php
S::startXhprof();
Mage::run($mageRunCode, $mageRunType);
S::stopXhprof();
 1
 2
 3
 4
 5
 6
 7
 8
 9
10
11
12
13
14
15
16
17
18
19
20
21
22
23
//file: /S.php
class S
{
    static protected $_xhprof_status = 0;
    static protected $_xhprof_enabled = false;
    static public function startXhprof()
    {
        if (self::$_xhprof_enabled) {
            xhprof_enable(XHPROF_FLAGS_NO_BUILTINS, array());
            self::$_xhprof_status = 1;
        }
    }

    static public function stopXhprof()
    {
        if (self::$_xhprof_status) {
            file_put_contents(
                (ini_get('xhprof.output_dir') ? : '/tmp') . '/' . time() . '.xhprof.xhprof',
                serialize(xhprof_disable())
            );
        }
    }
}

在此期间,遇到一个问题: XHProf 貌似不支持涉及操作 array 指针的系统函数,例如 current(), array_shift()等,在遇到这些方法的时候会直接 crash 掉,请求返回 ERR_EMPTY_RESPONSE。通过给xhprof_enable()函数传参XHPROF_FLAGS_NO_BUILTINS,忽略系统函数,可以避免这个问题。
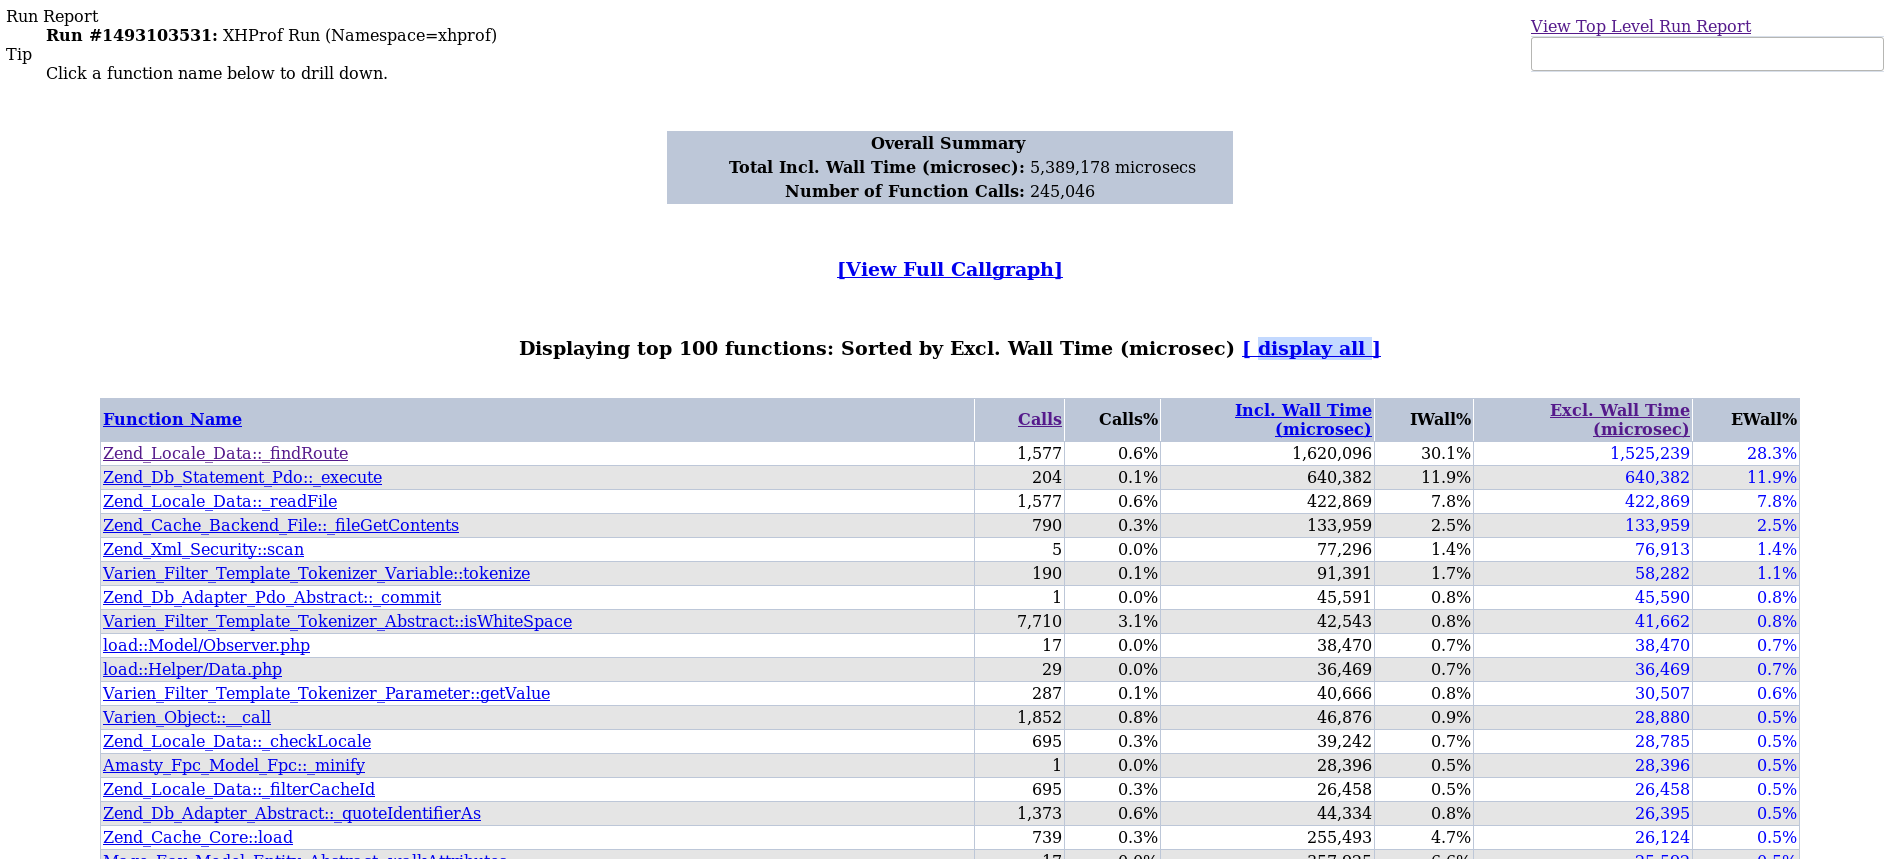
Result

其中:

  • funciton name : 函数名
  • calls: 调用次数
  • Incl. Wall Time (microsec): 函数运行时间(包括子函数)
  • IWall%:函数运行时间(包括子函数)占比
  • Excl. Wall Time(microsec):函数运行时间(不包括子函数)
  • EWall%:函数运行时间(不包括子函数)

优化性能,要找准目标,从有"巨大"潜力的地方入手,XHProf 可以为我们提供100个耗时最长的方法或者函数,这些运行缓慢的地方就是我下一步要关注的重点。

Built with Hugo
主题 StackJimmy 设计